An Introduction to Multi-Source Reasoning on the GMAT
Multi-Source Reasoning problems are one of the five problem types that appear in the Data Insights section of the GMAT. This problem type was designed to mimic the case study approach that many business schools use in their classrooms. Multi-Source Reasoning (MSR) prompts provide two or three tabs of text or data—charts, data tables, articles, emails, and so on—and then ask you a series of questions about this information.
Multi-Source Reasoning vs. Reading Comprehension
The MSR setup is similar to Reading Comprehension (read a lot of stuff first, then answer several questions), but MSR will include both quantitative and verbal-based information that you’ll need to integrate in order to answer the questions. MSR shares some other characteristics with Reading Comprehension:
- MSR prompts provide more information than you actually need in order to answer the questions. Part of your task is to figure out what information is necessary and what you can ignore.
- You will sometimes have to combine information from different MSR tabs.
- MSR prompts usually come with three accompanying questions (though this can sometimes vary).
Multi-Source Reasoning Question Types
Multi-Source Reasoning has two different multiple-choice question types.
1. Select One Out Of Five
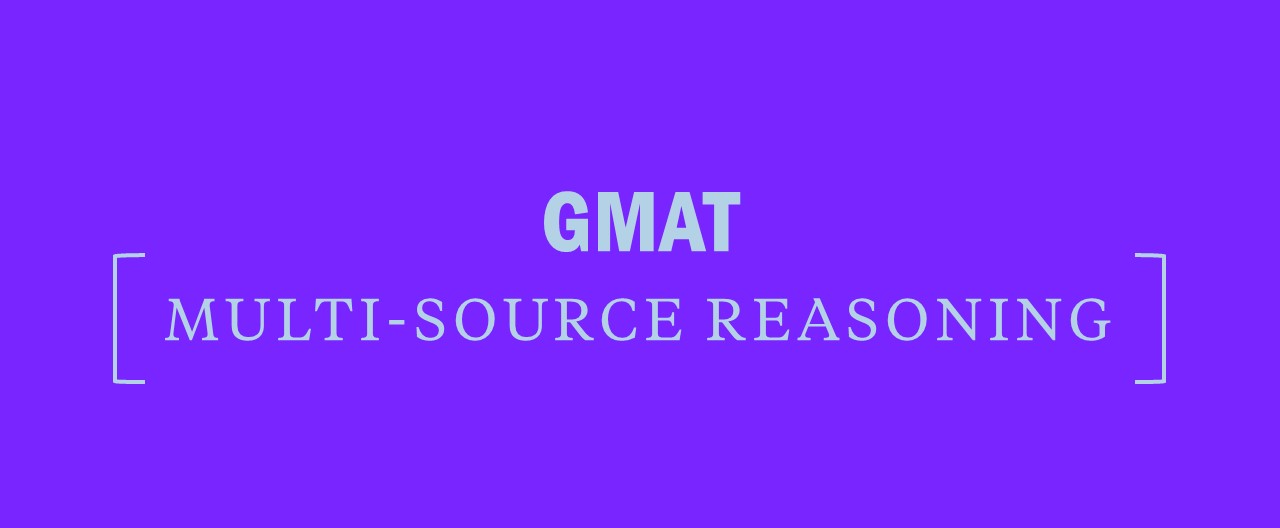
First, you can have a standard “select one answer out of five” multiple choice question. Here’s what that looks like:
2. Multiple-dichotomous Choice (Either-or)
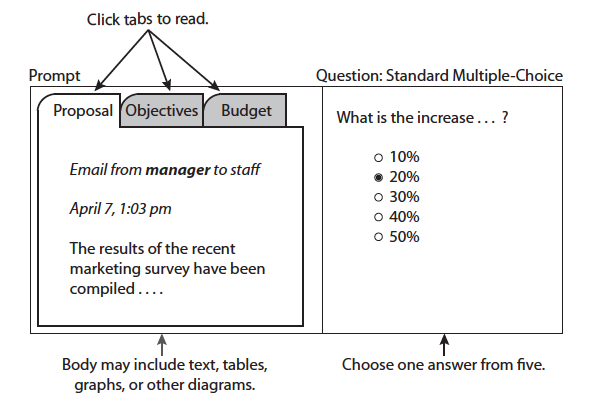
Second, you will also see what is officially called “multiple-dichotomous choice” questions—we call these either-or questions. You’ll be given three statements and asked to choose one of two options (that’s what dichotomous means)—e.g., True vs. False; Yes vs. No; Can be inferred vs. Can’t be inferred—for each statement:
For Either-Or problems, the three statements that appear together on the screen are considered one question. You have to choose the correct either-or option for each of the three statements in order to get that question right; there is no partial credit.
Most MSR prompts come with one regular multiple-choice question and two separate either-or questions (each with three statements to respond to).
[ RELATED: What’s Tested on the Data Insights Section of the GMAT ]
Sample GMAT Multi-Source Reasoning Question
Let’s try one of those either-or questions to see how they work. This MSR problem has two tabs of information (aka, the prompt), followed by the question.
Tab 1: Sales Breakout
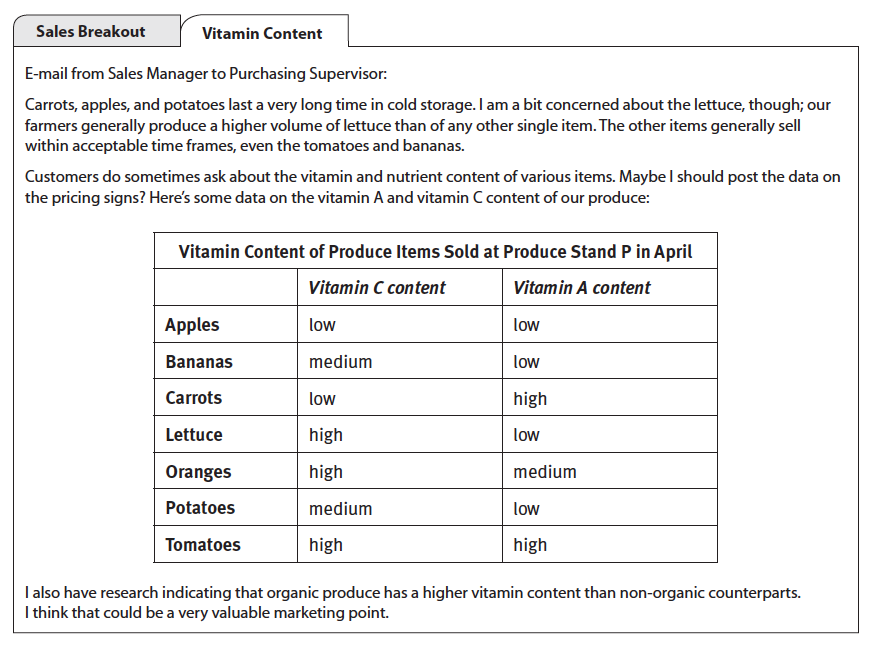
Tab 2: Vitamin Content
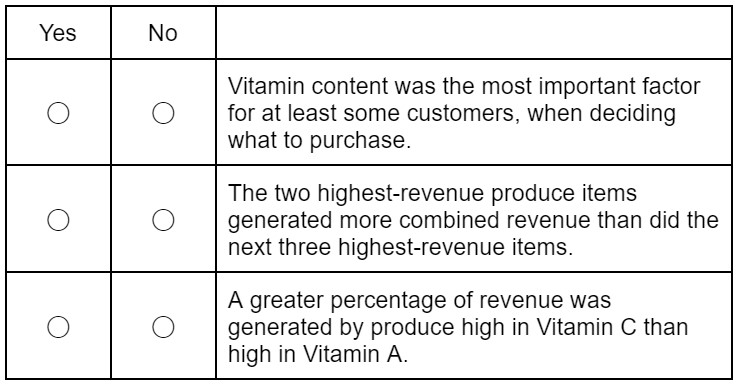
Each statement applies to Produce Stand P for the month of April. Select Yes if the statement can be proven to be true from the information provided. Otherwise, select No.
[ RELATED: How to Prepare for Data Insights Questions]
Key Highlights For Answering Multi-Source Reasoning Questions
- You will not have to use all of the information in the tabs. Do read through everything to understand the overall story and take some light notes to help you remember where things are. Don’t, though, try to memorize or take extensive notes. It’s an “open book” test—you can reread the text as needed.
- You’ll have multiple questions to answer, so the upfront time spent reading the prompt is spread across all of those questions. In this sense, MSR is the same as Reading Comprehension on the Verbal section of the exam.
When an MSR pops up on the screen, first confirm how many tabs there are—two or three? In this case, there are two.
Next, briefly glance at each tab and make a mental note of the kind of information—text, tables, graphs? In this case, the first tab has a graph with text and the second tab has a table with text.
Now that you’re oriented, go ahead and read through each tab, taking (very) light notes as you go.
How To Take Notes When Reading Multi-Source Reasoning Tabs
Here’s an example of how one person might do this (your thinking and notes will be different):
| the actual prompt | what they’re reading | what they jot down |
|---|---|---|
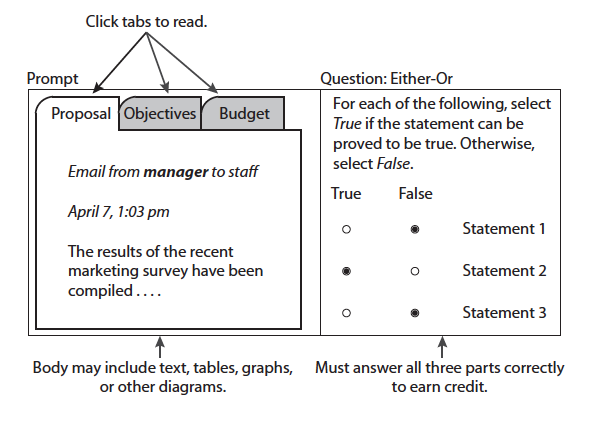
| [Tab 1] Email from Purchasing Supervisor to Sales Manager: | Two people talking about something… | |
| [Tab 1] Total April sales for your produce stand were $4,441; the itemized data is below. | [Glance at graph.] Bar chart. Shows % of sales coming from different items. No $ numbers in the chart. Every food type starts with a different letter, so can use single letters to abbreviate. | T1 [stands for “Tab 1”] Apr rev = $4,441 |
| [Tab 1] We already know that customers base their purchasing decisions on whether something is in season and how much it costs. Management believes that customers also care about the health factor, such as how high the vitamin content is for different types of produce. Do you have any data that could help us to evaluate this question? | People care about season and cost. And maybe health factors? | T1 Apr rev = $4,441 season, cost health?? |
| [Tab 1] We also need to think about pricing strategies in light of the fact that some items have a far longer shelf life. Potatoes will last weeks in cold storage, while the tomatoes won’t last more than a few days without suffering a reduction in quality. Please send me any information you have about spoilage rates or other factors we should consider when setting prices. | Some stuff spoils faster, like tomatoes. What to consider when setting prices? | T1 Apr rev = $4,441 season, cost health?? spoil rate?? |
| [Tab 1 Graph] | Already looked at this… | T1 Apr rev = $4,441 season, cost health?? spoil rate?? Bar chart: % rev by item |
When you’ve finished the first tab, pause for a second. Is there anything that seems extra important? Anything that seems extra confusing? Make a mental or actual note and move to the next tab.
Also, depending on the text you read, you may have to look at the diagram or chart again—if, for example, the text provides context that changes how you would interpret the data.
| the actual prompt | what they’re thinking | what they jot down |
|---|---|---|
| [Tab 2] Email from Sales Manager to Purchasing Supervisor: | Replying back… | |
| [Tab 2] Carrots, apples, and potatoes last a very long time in cold storage. I am a bit concerned about the lettuce, though; our farmers generally produce a higher volume of lettuce than of any other single item. The other items generally sell within acceptable time frames, even the tomatoes and bananas. | Lettuce is a concern…everything else is fine. | T1 Apr rev = $4,441 season, cost health?? spoil rate?? Bar chart: % rev by item T2 L spoils |
| [Tab 2] Customers do sometimes ask about the vitamin and nutrient content of various items. Maybe I should post the data on the pricing signs? Here’s some data on the vitamin A and vitamin C content of our produce: | Vitamin content might be important. [Glance at table] It shows Vitamin A and Vitamin C content for each item, by low, medium, and high. | T1 Apr rev = $4,441 season, cost health?? spoil rate?? Bar chart: % rev by item T2 L spoils Table: VitA + VitC: L, M, H |
How does the information in the two tabs connect?
The chart and the table both list a bunch of fruits and vegetables, at least some of which are the same—so you know both % of revenue and vitamin levels for at least some of these items. (It’s not necessary to check whether the list in each tab is identical. Wait to see what questions you get asked.)
The chart shows % of sales, and the first tab gave total revenue, so it’s possible to calculate the amount of revenue from each item.
What didn’t they tell you? They provided revenue data but not volume of what was sold. So even though the chart indicates that potatoes generated the most revenue, it’s not possible to tell whether more pounds or units of potatoes were sold than of any other type of food. Maybe the potatoes are just the most expensive item on a per-pound or per-unit basis.
You don’t need to thoroughly brainstorm every possible thing that the data does and doesn’t tell you, but do spend 20 to 30 seconds noticing any major things that jump out at you.
Then, move to the first question. (In this case, the only question, since we only gave you one.)
The question stem instructs you to select Yes if the statement can be proven from the information given in the prompt. And then it says “Otherwise, select No.” There’s a subtle point to note with this wording.
No does not mean “this statement can be proven false.” Rather, No means “this statement can’t be proven true.” You may be able to prove a statement false. Alternatively, you may not be able to tell whether a statement is true or false. In either case, select No as the answer. Only select Yes when you can prove the statement true from the given information.
The first statement
Vitamin content was the most important factor for at least some customers when deciding what to purchase.
The person who wrote the first tab did mention health, but they asked whether health factors or vitamin content might be important. They didn’t provide any data or information about vitamin content. So go back to the second tab to skim the text for relevant details.
“Customers do sometimes ask about the vitamin and nutrient content of various items.”
It would be accurate to say that at least some customers care enough about vitamin content to ask about it. But there’s no evidence to support the idea that vitamin content is the most important factor for any of these customers. (A harder statement might say that vitamin content is one of the most important factors—but this can’t be proven either. Someone may ask a question about something and still not rate that thing as one of the most important factors.)
This statement could be true but it doesn’t have to be true.
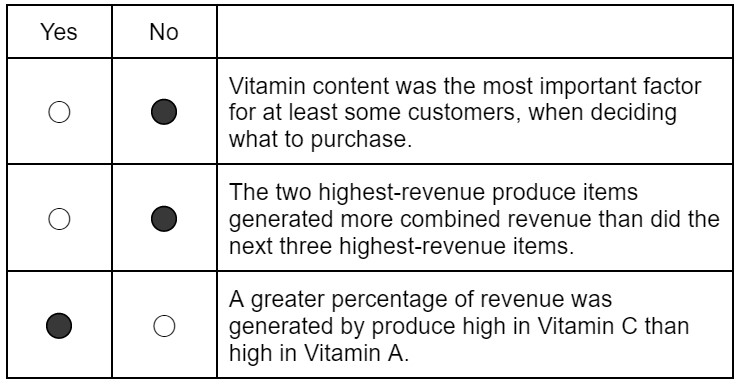
The correct answer for statement 1 is No.
[ GMAT Expert Tip: Precision of language matters. Don’t rely on memory—check the prompt for proof. ]
The second statement
The two highest-revenue items generated more combined revenue than did the next three highest-revenue items.
Actual revenue can be calculated and you do have access to a (very basic) on-screen calculator for the IR section of the GMAT. But don’t just start madly calculating. What’s the minimum math needed to test this statement?
It’s asking about a relative value—so the percentages given in the chart are enough.
2 highest-revenue:
- Potatoes ~23%
- Lettuce ~19%
- Total ~42%
Next 3-highest:
- Tomatoes: ~18%
- Oranges: ~17%
- Bananas: ~13%
- Total: Add up 17 and 13 first to get 30. Add 18…yep, that’s more than 42% (stop the calculation at the point that you know which one is greater—that’s all that matters)
So this statement is actually false—the two highest-revenue items did not add up to more than the next three combined.
The correct answer for statement 2 is No.
[ GMAT Expert Tip: Don’t do the math you don’t have to do. Pause and think through what you really need—and what you don’t need. ]
The third statement
A greater percentage of revenue was generated by produce high in Vitamin C than high in Vitamin A.
Many MSR questions will require you to combine information from more than one tab—as this statement does. You need to connect the vitamin data in tab 2 with the revenue percentage data from tab 1.
As before, pause and think through what data you actually need. The statement restricts itself to produce that is high in Vitamin C or Vitamin A—so you can ignore the low and medium labels.
Jot down the first letters of the ones high in Vitamin C:
- L
- O
- T
And the ones high in Vitamin A:
- C
- T
Pause again. The question asks about the percentage of revenue contributed by each of these. Tomatoes are on both lists…so they’ll contribute the exact same percent to each group. Therefore, ignore the tomatoes.
Vitamin C:
- L = ~19%
- O = ~17%
Vitamin A:
C = wait a second…
Carrots represented the least percentage of revenue. So whatever is in the Vitamin C bucket is going to add up to more than carrots. No actual math needed. Lay out all of the math before you actually calculate. Sometimes, you’ll find that you don’t need to calculate anything at all.
The correct answer for statement 3 is Yes.
[ GMAT Expert Tip: You will sometimes need to combine information from multiple tabs. Collect and analyze the information first, before calculating anything. ]
Sample GMAT Multi-Source Reasoning Question Answers
The three correct answers are as follows:
Now you know how to do Multi-Source Reasoning problems on the GMAT. A lot of people aren’t fans of this problem type; there’s so much information that MSR can seem overwhelming.
And that’s exactly what case studies can feel like in business school—so use your MSR studies as an opportunity to hone your efficiency and information integration skills:
- What info is useful and what info can I ignore (at least for now)?
- What are they really asking?
- What’s the minimum that I need to answer that question?
This is no different than the decision-making process used by any effective manager or leader: Balance effectiveness and efficiency so that you can move your business forward with maximum results. Studying for the GMAT can actually help you hone these decision-making skills.


