LSAT Raw Score Conversion
Find out what a raw, scaled and percentile LSAT score is and how to convert one into another.
LSAT Score Types
- A raw LSAT score is simply the number of questions answered correctly.
- A scaled LSAT score is a conversion of the raw score, also known as the familiar 120–180 number. For example, a raw score of 67 is 67 correct answers, which converts to a scaled score of 170. A raw score of 58—meaning 58 correct answers—converts to a scaled score of 162.
- LSAT percentile scores indicate how a test taker performed relative to other test takers over a three-year period. The conversion from scaled score to percentile score remains relatively stable, with only minor variations over the years. Test after test, a 153 —154 scaled score is approximately a 50th percentile score.
On a previous test, a raw score of 58 might convert to a 150 or a 152. To account for differences in overall difficulty, each iteration of the LSAT has a slightly different raw score-to-scaled score conversion table.
LSAT Score Conversion Chart
LSAT scoring looks a bit different these days. The exam features three scored sections and roughly 75 points. Below is the scoring scale LSAC released for the May 2020 LSAT Flex, fully updated with official LSAC percentile data for the 2022–2025 testing years. Even though the LSAT Flex itself is no longer administered, its raw-to-scaled scoring framework remains the most accurate reflection of the current LSAT format.
| Reported LSAT Score | Lowest Raw LSAT Score | Highest Raw LSAT Score | Current Percentile Rank (LSAC 2022–2025) |
|---|---|---|---|
| 180 | 74 | 75 | 99.89% |
| 179 | 73 | 73 | 99.80% |
| 178 | n/a | n/a | 99.66% |
| 177 | 72 | 72 | 99.46% |
| 176 | 71 | 71 | 99.20% |
| 175 | n/a | n/a | 98.91% |
| 174 | 70 | 70 | 98.44% |
| 173 | 69 | 69 | 97.86% |
| 172 | n/a | n/a | 97.13% |
| 171 | 68 | 68 | 96.22% |
| 170 | 67 | 67 | 95.07% |
| 169 | 66 | 66 | 93.78% |
| 168 | 65 | 65 | 92.21% |
| 167 | 64 | 64 | 90.56% |
| 166 | 63 | 63 | 88.68% |
| 165 | 62 | 61 | 86.50% |
| 164 | 60 | 61 | 84.17% |
| 163 | 59 | 59 | 81.63% |
| 162 | 58 | 58 | 79.00% |
| 161 | 57 | 57 | 75.96% |
| 160 | 55 | 56 | 72.92% |
| 159 | 54 | 54 | 69.84% |
| 158 | 53 | 53 | 66.38% |
| 157 | 51 | 52 | 63.01% |
| 156 | 50 | 50 | 59.54% |
| 155 | 48 | 49 | 55.91% |
| 154 | 47 | 47 | 52.33% |
| 153 | 45 | 46 | 48.72% |
| 152 | 44 | 44 | 45.09% |
| 151 | 43 | 43 | 41.42% |
| 150 | 42 | 42 | 38.06% |
| 149 | 40 | 41 | 34.68% |
| 148 | 39 | 39 | 31.41% |
| 147 | 37 | 38 | 28.27% |
| 146 | 36 | 36 | 25.24% |
| 145 | 35 | 35 | 22.46% |
| 144 | 34 | 34 | 19.93% |
| 143 | 33 | 33 | 17.47% |
| 142 | 31 | 32 | 15.27% |
| 141 | 30 | 30 | 13.21% |
| 140 | 29 | 29 | 11.47% |
| 139 | 28 | 28 | 9.81% |
| 138 | 27 | 27 | 8.39% |
| 137 | 26 | 26 | 7.18% |
| 136 | 25 | 25 | 6.09% |
| 135 | 24 | 24 | 5.16% |
| 134 | 23 | 23 | 4.38% |
| 133 | 22 | 22 | 3.68% |
| 132 | 21 | 21 | 3.14% |
| 131 | 20 | 20 | 2.65% |
| 130 | n/a | n/a | 2.27% |
| 129 | 19 | 19 | 1.92% |
| 128 | 18 | 18 | 1.64% |
| 127 | 17 | 17 | 1.41% |
| 126 | n/a | n/a | 1.21% |
| 125 | 16 | 16 | 1.04% |
| 124 | n/a | n/a | 0.92% |
| 123 | 15 | 15 | 0.82% |
| 122 | 14 | 14 | 0.74% |
| 121 | n/a | n/a | 0.64% |
| 120 | 0 | 13 | 0.00% |
Historic LSAT Score Conversion Charts
Take a look at an example conversion chart based on PrepTest 74 versus LSAC’s latest percentile scores.
| Raw Score | Scaled Score | PrepTest 74 Percentiles | Latest Percentile (LSAC 2022–2025) |
|---|---|---|---|
| 92 | 172 | 99th | 97.13% (Dropped 2%) |
| 85 | 167 | 95th | 90.56% (Dropped ~4%) |
| 80 | 164 | 90th | 84.17% (Dropped ~6%) |
| 74 | 160 | 80th | 72.92% (Dropped ~7%) |
| 67 | 156 | 70th | 59.54% (Dropped ~10%) |
| 63 | 154 | 60th | 52.33% (Dropped ~8%) |
| 58 | 151 | 50th | 41.42% (Dropped ~9%) |
| 54 | 149 | 40th | 34.68% (Dropped ~5%) |
| 49 | 146 | 30th | 25.24% (Dropped ~5%) |
| 44 | 143 | 20th | 17.47% (Dropped ~2.5%) |
| 38 | 139 | 10th | 9.81% (Unchanged) |
These historic examples (PrepTests 1-80) feature raw score conversions from when there were 4 scored sections and roughly 100 points. The new LSAT only has three scored sections and roughly 75 points.
Historic LSAT Scoring Percentiles (Ranges)
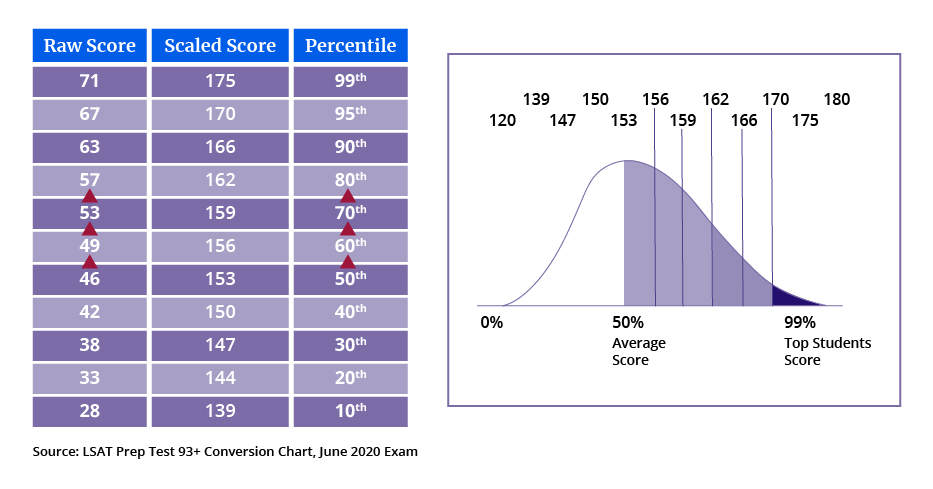
Take a look at an example conversion chart with scoring ranges based on Prep Test 93 from June 2020:
How LSAT Scoring Impacts Performance
The way in which the LSAT is scored has three important implications for your performance:
- The number of correct answers determines your score. There is no guessing penalty. Never leave a question blank on the LSAT.
- Every question is worth the same, regardless of how hard it is. Learn to spot difficult questions and leave them for the end of each section. Find the easy questions and rack up points. If you’re going to run out of time or need to guess, you want to do so on the tough stuff.
- Every additional correct answer can leapfrog you ahead of hundreds—or even thousands—of other test-takers, your competition. How’s that for inspiration?
What’s a Good LSAT Score?
What you consider a good LSAT score depends on your own expectations and goals. Here are a few interesting statistics.
If you got about half of all of the scored questions right (a raw score of roughly 38), you’d earn a scaled score of 147, putting you in about the 30th percentile—not a great performance. However, as you saw above, a little improvement goes a long way. Getting an additional 8 questions right would give you a raw score of 46, pushing you up to 153, which is about the 50th percentile—a huge improvement.
So, you don’t have to be perfect to do well. Every LSAT throughout the year is different, but on a typical LSAT, you can still get around 18–19 questions wrong and still end up in the 160s—or about 12 wrong and get a 167, a 90th percentile score. Even a perfect score of 180 often allows for a question or two to be missed.