ACT Science: Strengthen Hypothesis
Science questions on the ACT Science section may ask you if a piece of evidence, always supplied in the reading passage or in a chart, graph or table, supports and strengthens the hypothesis put forth in the passage. Answering strengthen hypothesis questions require you to identify a hypothesis and understand how data can strengthen or weaken that argument. Although this question type can be time consuming to answer, getting the proper test prep will help you master strengthen hypothesis questions. So will these tips and strategies:
Strengthen Hypothesis Practice Question
Stars often form in large groups. For instance, an “open cluster” such as the Pleiades may contain hundreds of stars that were formed at approximately the same time (and are thus the same age). Even larger “globular clusters” may contain a million or more stars of approximately the same age. By observing clusters of increasing age, astronomers are able to see how the brightness and temperatures of stars change as they age.
Shortly after a group of stars forms, a plot of their brightness versus their color shows that they form a diagonal line called the “Main Sequence.” The bluest stars, are the brightest, and the reddest stars are the dimmest. (Star colors are divided into a series of “spectral classes” – O, B, A, F, G, K. A star’s brightness is expressed as an “absolute visual magnitude,” with the dimmest stars having the largest magnitudes.)
After millions of years, the bluest stars in the cluster begin to swell into “giant” or “supergiant” stars, and they become redder. Thus, they no longer lie on the Main Sequence line. As the cluster gets older, the same process happens to redder and redder stars.
Astronomers observing a nearby galaxy have measured the position of the “turnoff” in 25 globular clusters. If the turnoff occurs at the same spectral class in different globular clusters, those clusters must be of approximately the same age. Furthermore, if most of the clusters in a galaxy are of similar ages, the galaxy itself may be of that age. Figure 2 shows the number of clusters with turnoffs in each spectral class.
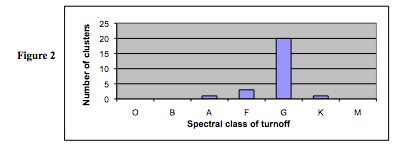
Does Figure 2 support the hypothesis that most of the galaxy’s globular clusters are of similar ages?
- No, Figure 2 shows that the clusters in the galaxy have different turnoffs, and thus different ages
- No, Figure 2 shows that the turnoffs of the clusters vary from A to K in spectral class, and these clusters thus vary widely in age
- Yes, Figure 2 shows that most of the clusters in the galaxy have a turnoff in spectral class G, and are thus similar in age
- Yes, Figure 2 shows that all of the clusters in the galaxy have a turnoff, and are thus similar in age
There are several things you need to know to figure out if Figure 2 supports the passage’s hypothesis. First, you need to know the hypothesis, which is “Stars often form in large groups.” Now, we have to examine Figure 2 to figure out what information it’s relaying. The y-axis shows an increase in the number of clusters as we move up; the x-axis labels the different spectral class of “turnoff” for the star. What we then see is that Figure 2 shows the highest number of clusters in the G class of turnoff, meaning that the scientists’ hypothesis is correct. If we examine the answer choices, we can eliminate A and B since they misinterpret the question. C looks correct since the chart shows most of the clusters in spectral class G and the passage told us this meant they were of similar age. And D doesn’t seem to mention any points mentioned in the passage or chart. We’re left with C as the correct answer.
By following the tips and strategies above, you’ll be able to solve any strengthen hypothesis question on the ACT.