ACT Math: Coordinate Geometry
Some of the most challenging Math questions on the ACT involve Coordinate Geometry, so it’s important you have a solid grasp on the formulas and concepts tested. The most basic concept you’ll encounter is inequalities. To graph a range of values, you’ll need to draw a number line and plot the beginning and end of the range using an open or closed circle and a solid line.
Which of the following graphs represents the solution to the set of the inequality |x| > 3 on the real number line?
For this question, we need to solve |x| > 3 before we can graph it. Remember that the ACT loves to make seemingly easy problems more difficult by combining them with other topics (like absolute value). We have to remove the absolute value symbol by splitting the inequality in two, and we have to remember to flip the sign for the inequality that becomes negative.
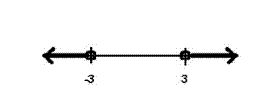
x > 3 x < – 3
This is the correct graph for these two ranges of values. The circles must be open because the symbols don’t have the line that indicates “or equal to”.
A few more formulas to know:
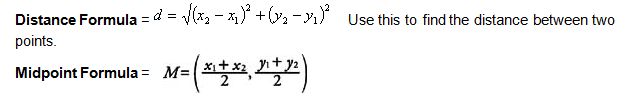
Use this to find the midpoint between two points (notice how you are essentially finding the average of the x-coordinates and the average of the y-coordinates).
Slope = Rise / Run = Change in y / Change in x
As long as you know any two points on a line, you can find the slope. Remember that parallel lines have the same slope, and perpendicular lines have negative reciprocal slopes.
You’ll also need to know how to recognize the graphs for linear and non-linear equations.
y = mx + b This is called slope-intercept form. An equation in this form will always make a straight line on a graph (notice how neither x nor y have an exponent). In this form, b is the y-intercept (the point on the y-axis where the line crosses) and m is the slope.
y = ax 2 + bx + c This is the standard equation for a parabola. In this equation c represents the y-intercept. A standard equation in which a variable is squared will never make a straight line.
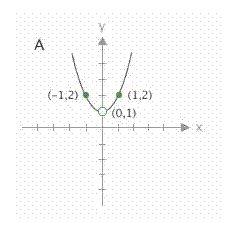
In this question, we are asked to determine whether or not this is the correct graph for the equation y = (x3 + x)/x
Don’t get nervous if the equation given does not match the standard equation for a parabola. Often you can simplify it! This equation simplifies to y = x2 + 1. We can see from the graph that the y-intercept is indeed 1. When we plug in the x-coordinates of the other two given points, we see that this must be the correct equation. A great rule for coordinate geometry: when in doubt, plug in!
The standard equation of a circle is (x – h)2 + (y – k)2 = r2 where (h, k) is the center point of the circle and r is the radius. For example, on test day you might see a circle plotted on a graph like so:
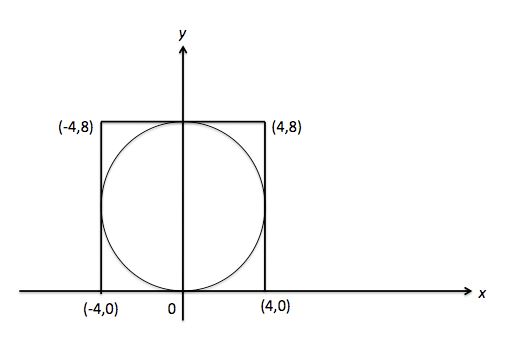
The question will ask you to find the equation of the circle. All we have to find is the center point (0, 4) and the radius (4), and then plug it into our equation.
(x – h)2 + (y – k)2 = r2
(x – 0)2 + (y – 4)2 = 42
(x)2 + (y – 4)2 = 16