PSAT Math: Function Behavior and Transformations
When describing the graph of a function or an interval (a specific segment) of a function, the trend of the relationship between the x- and y- values while reading the graph from left to right is often important. Three terms you are sure to see in more difficult function questions are increasing, decreasing, and constant. Let’s look at what these terms mean and how they apply to PSAT questions.
- Increasing functions have y-values that increase as the corresponding x-values increase.
- Decreasing functions have y-values that decrease as the corresponding x-values increase.
- Constant functions have y-values that stay the same as the x-values increase.
The PSAT can ask about function trends in a variety of ways. The most basic would be to examine a function’s behavior and determine whether (and where) the function is increasing, decreasing, or constant. Tougher questions might ask you to identify the trend and then explain what it means in the context of a real-life situation presented in the question, or to identify the effect a transformation would have on the trend of a function.
A function transformation occurs when a change is made to the function’s equation or graph. Transformations include translations (moving a graph up/down, left/right), reflections (flips about an axis or other line), and expansions/compressions (stretching or squashing horizontally or vertically). How do you know which is occurring? The following table provides some rules for guidance when altering a hypothetical function f(x).
PSAT Math: Transforming Functions
| Algebraic Change | Corresponding Graphical Change | Graph | Algebraic Change | Corresponding Graphical Change | Graph |
| f(x) | N/A—original function | 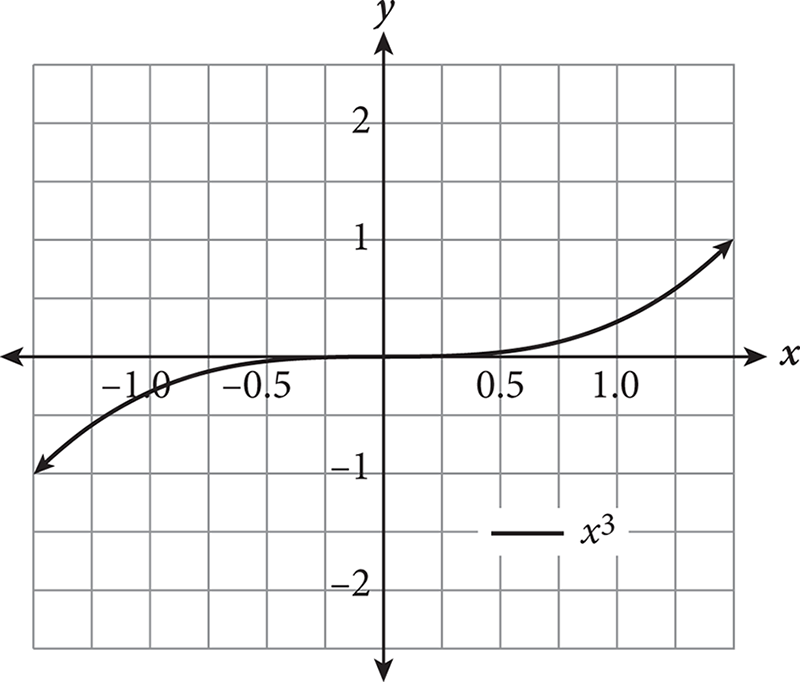 |
f(x + a) | f(x) moves left a units | 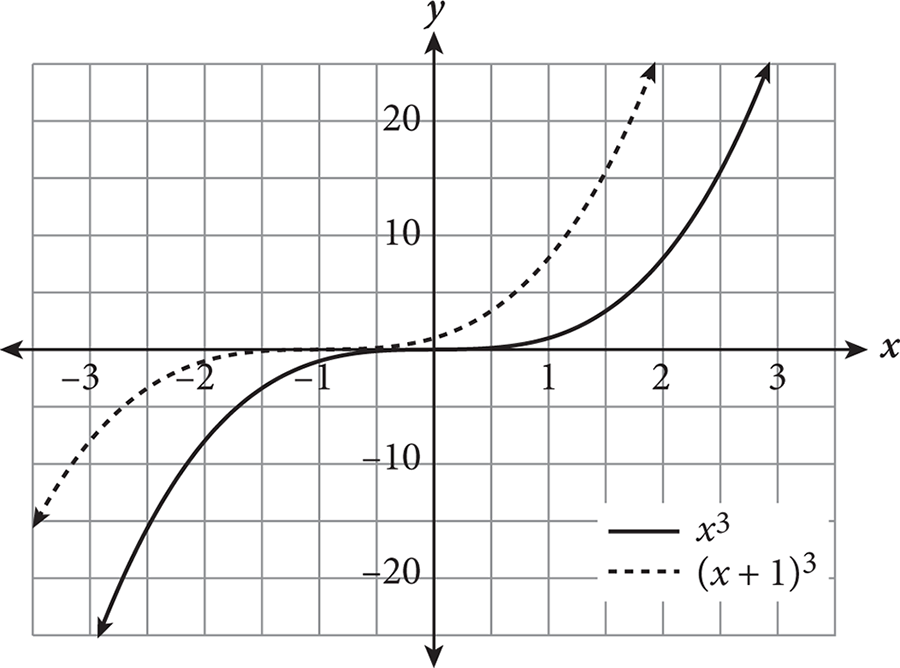 |
| f(x) + a | f(x) moves up a units | 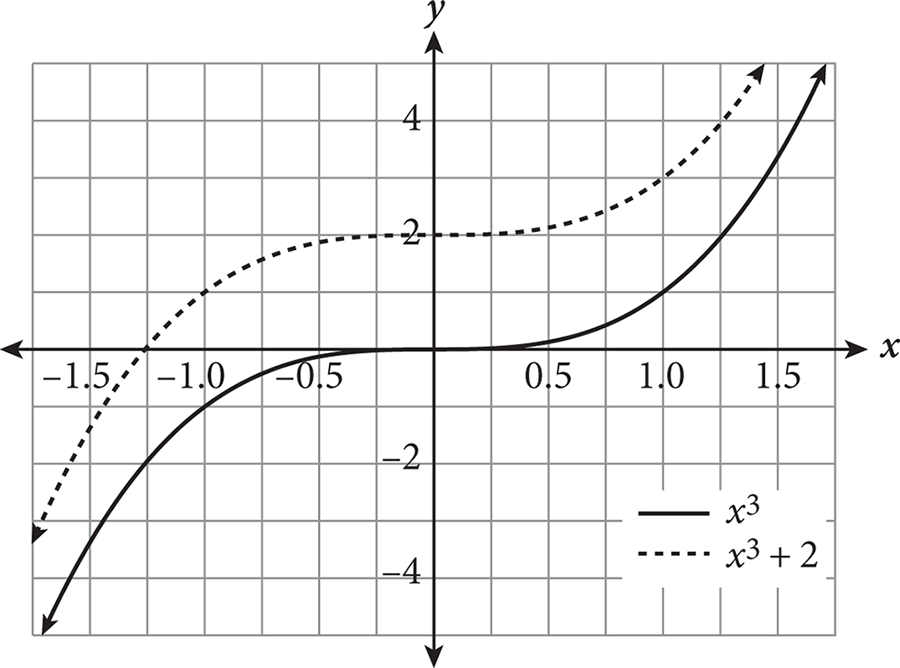 |
f(x − a) | f(x) moves right a units | 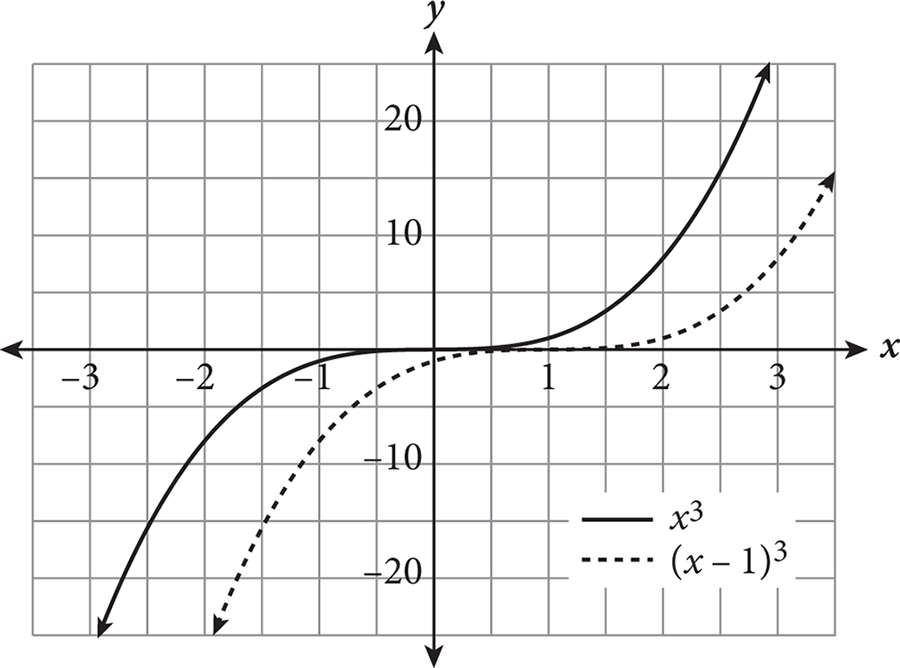 |
| f(x) − a | f(x) moves down a units | 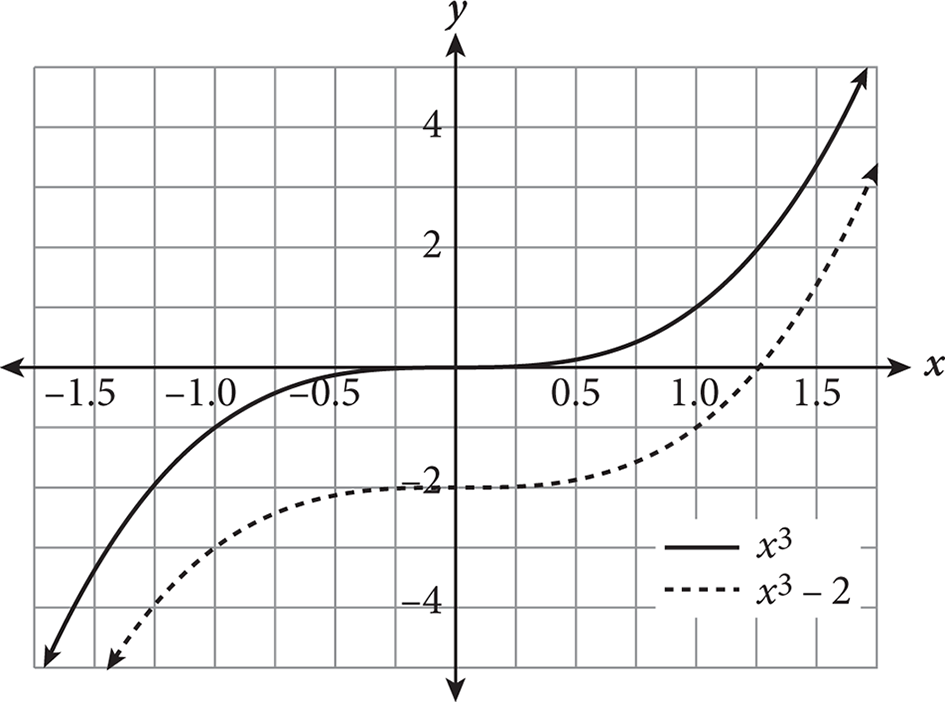 |
− f(x) | f (x) reflected over the x-axis (top to bottom) | 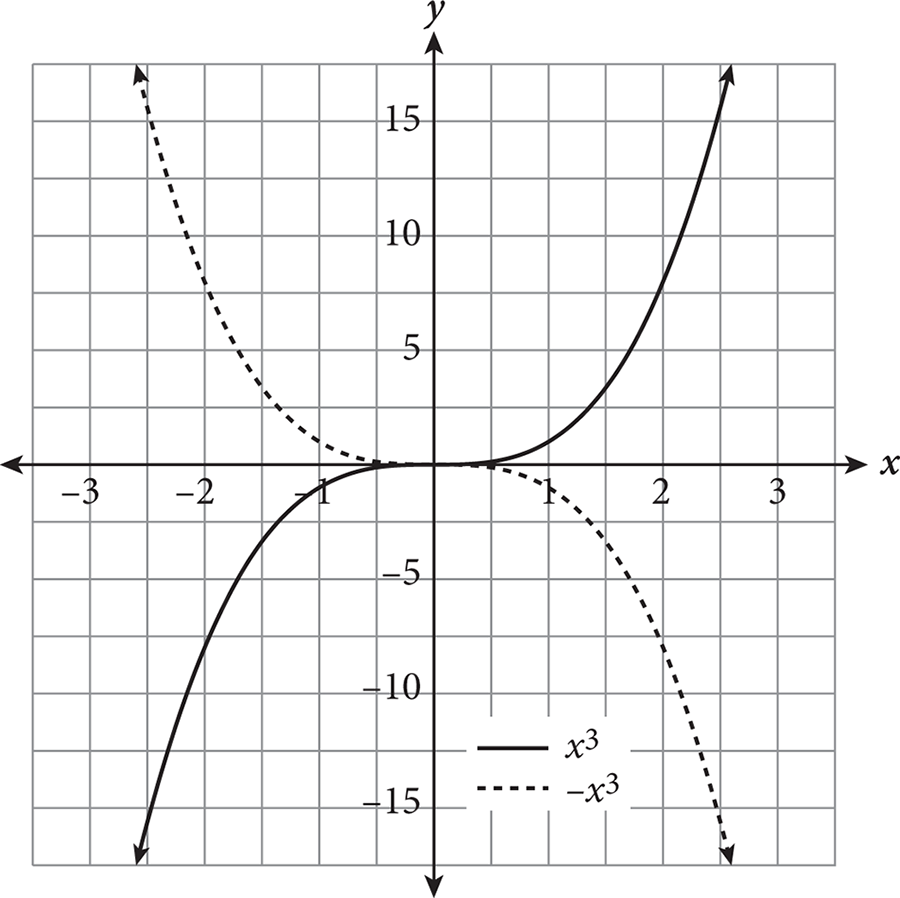 |
| f(−x) | f(x) reflected over the y-axis (left to right) | 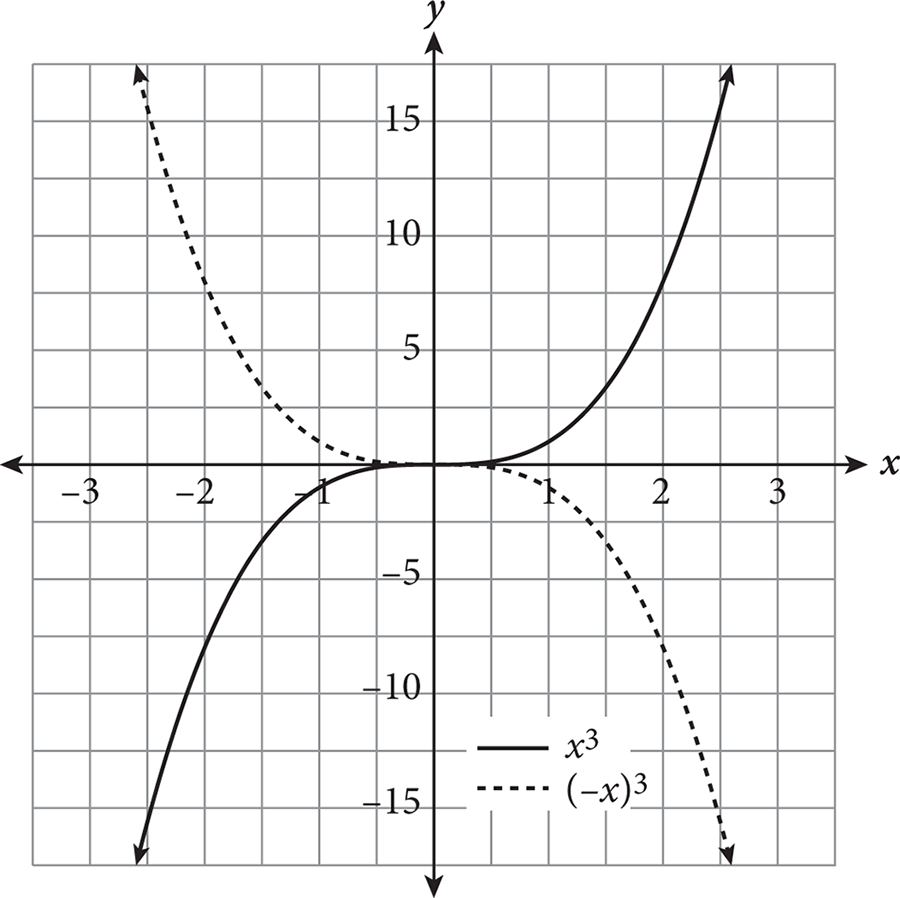 |
af(x) (0 < a < 1) | f (x) undergoes vertical compression | 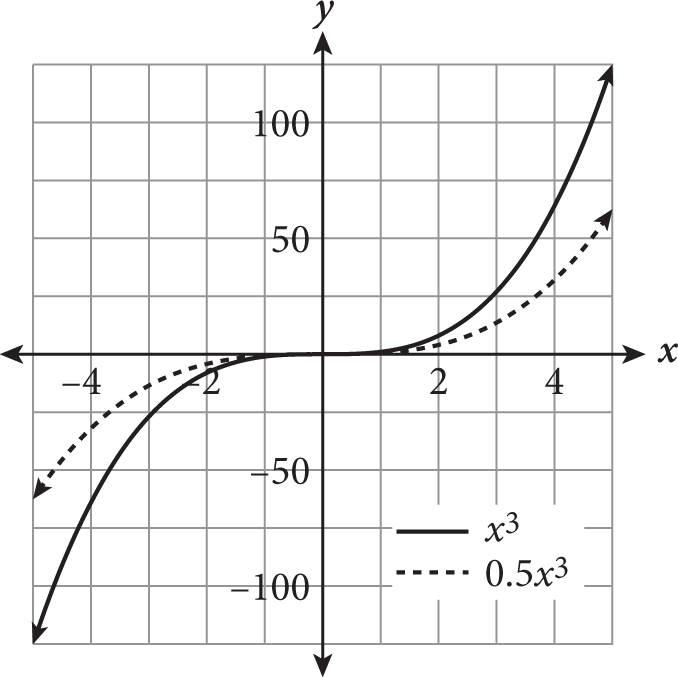 |
| f(ax) (0 < a < 1) | f(x) undergoes horizontal expansion | 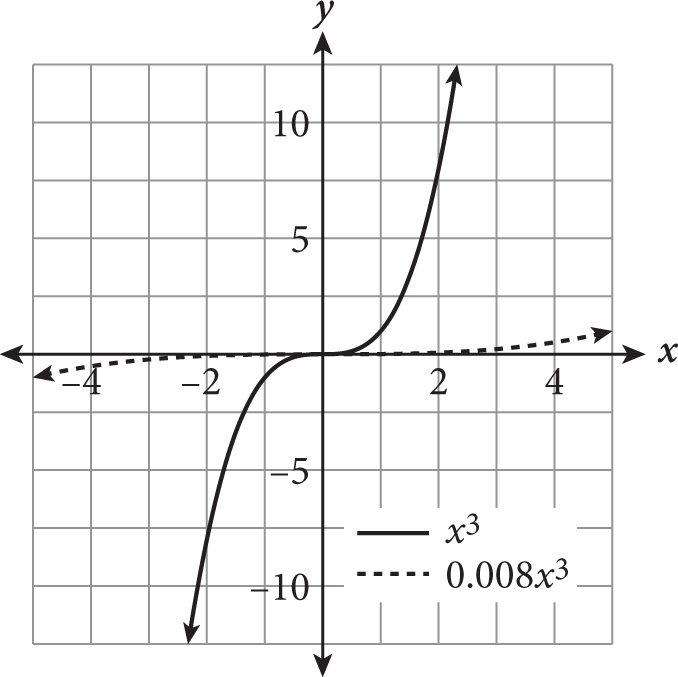 |
af(x)(a > 1) | f (x) undergoes vertical expansion | 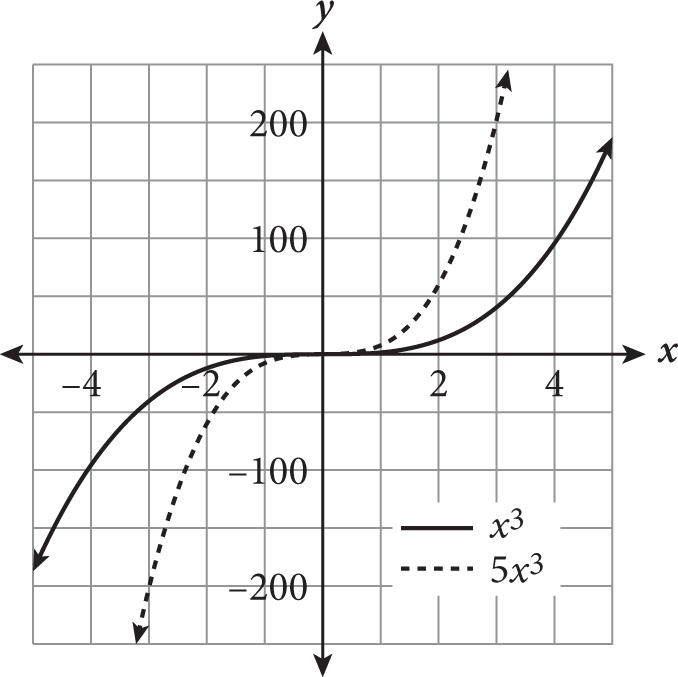 |
| f(ax)(a > 1) | f(x) undergoes horizontal compression | 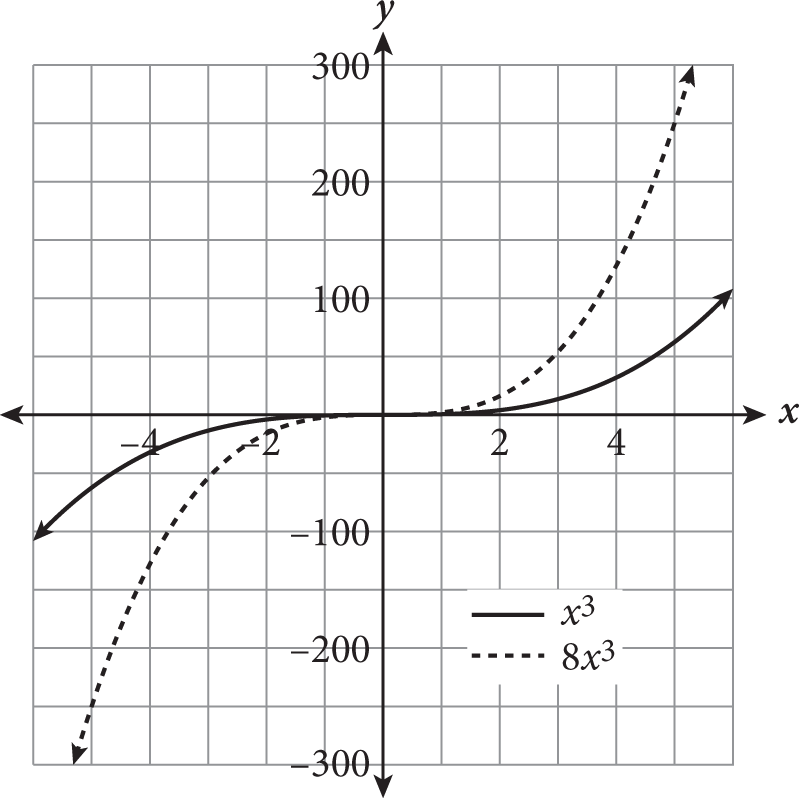 |
|||
If you forget what a particular transformation looks like, you can always plug in a few values for x and plot the points to determine the effect on the function’s graph.
Expert Tip
If you forget what a particular transformation looks like, you can always plug in a few values for x and plot the points to determine the effect on the function’s graph.
Expert Tip
Adding or subtracting inside the parentheses of a function will always cause a horizontal change (e.g., shift left/right, horizontal reflection); if the alteration is outside the parentheses, the result is a vertical change.
Note
Note that the slope of the function post-translation is identical to that of the original function. Translations only shift a function and do not impact slope.
PSAT Practice Question: Transforming Functions
A function transformation question for you to try follows.
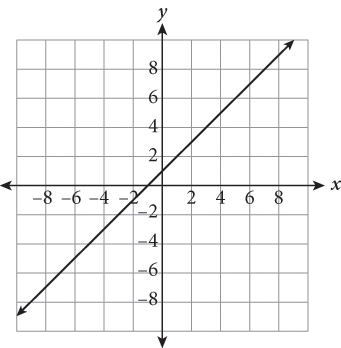
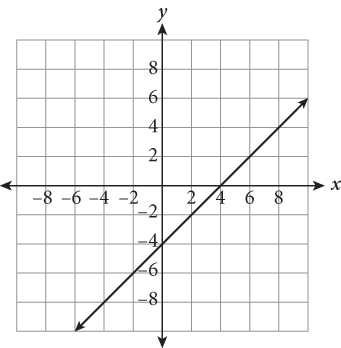
1. The graph above represents the function f (x). Which of the following choices corresponds to f(x – 2) – 5 ?
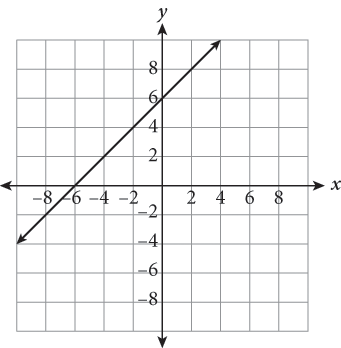
A.
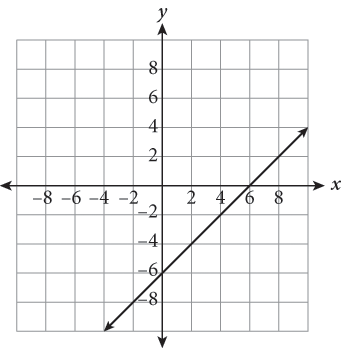
B.
C.
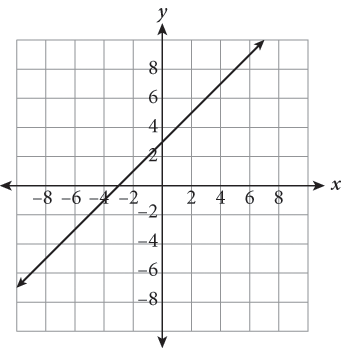
D.
Use the Kaplan Method for Math to solve this question, working through it step-by-step. The following table shows Kaplan’s strategic thinking on the left, along with suggested math scratchwork on the right.
| Strategic Thinking | Math Scratchwork |
| Step 1: Read the question, identifying and organizing important information as you goYou must determine which graph shows the transformation specified in the question stem. | |
| Step 2: Choose the best strategy to answer the questionHow do you begin solving?First, determine what the transformation is.Next, identify a couple of easy points on the initial function and apply the transformation “instructions” to them. The y-intercept is a good choice here.On which graph do the transformed points lie?Determine which answer’s graph contains the new coordinates. | graph moves 2 units right and 5 units down(0, 1) becomes (2, −4)(1, 2) becomes (3, −3)new points fall on the graph of (B) |
| Step 3: Check that you answered the right questionThe only matching graph is (B). |
Expert Tip
If you’re better with algebra, plug the transformation changes into the original function instead of picking points. Substituting x − 2 for x and subtracting another 5 gives y = [(x − 2) + 1] − 5 = x − 6. The graph of y = x − 6 clearly corresponds to (B).