PSAT Math: Advanced Functions
The ability to interpret the graph of a function will serve you well on Test Day. To interpret graphs of functions, you’ll need to utilize the same skills you use to interpret “regular” equations on the coordinate plane, so this material shouldn’t be completely foreign.
You should know that a function is merely a dressed-up equation, so translating from function to “regular” notation or vice versa is a straightforward process. Consider the following brief example.
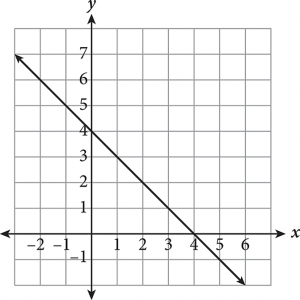
Suppose you’re asked to find the value of x for which f(x) = 6. Because f(x) represents the output value, or range, translate this as “When does the y value equal 6?” To answer the question, find 6 on the y-axis, then trace over to the function (the line). Read the corresponding x value: It’s −2, so when f(x) = 6, x must be −2.
The PSAT might also present functions in the form of tables. These may or may not have an equation associated with them, but regardless, you’ll need to be adept at extracting the information necessary to answer questions. Most of the time the table will have just two columns, one for the domain and another for the range.
Remember: A value of f(x) corresponds to a location along the y-axis. A value of x corresponds to a location on the x-axis.Expert Tip
Now let’s try a test-like example.
PSAT Math Practice Question: Functions
![]()
A. −4
B. 6
C. 10
D. 14
Work through the Kaplan Method for Math step-by-step to solve this question. The following table shows Kaplan’s strategic thinking on the left, along with suggested math scratchwork on the right.
| Strategic Thinking | Math Scratchwork |
|---|---|
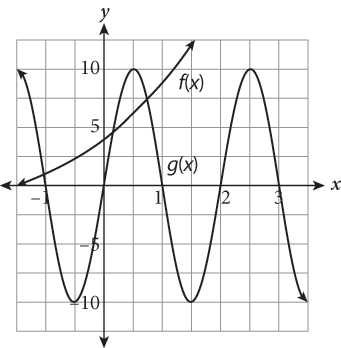
| Step 1: Read the question, identifying and organizing important information as you go You’re asked to determine the value of f ( 0 ) + g ( 1/2 ) . In other words, you need to find the y-value of function f when x = 0 and the y-value of function g when x = 1/2 , then add those values together. |
|
| Step 2: Choose the best strategy to answer the question How can you find f(0)? Start with f (x). Locate the spot on the graph of f (x) where x = 0. At that point, the y-value is 4. Therefore, f (0) = 4. What about g(1/2) ? |
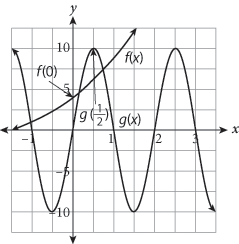 |
| Step 3: Check that you answered the right question You found f ( 0 ) + g ( 1/2 ) , which matches (D). You’re finished. |
f (0) + g(1/2) = 4 + 10 = 14 |
Watch your axis scales; just like scatterplot questions, questions involving graphs of functions often contain trap answers for students who misread the axes.
Although this question would have been much simpler if the graph had labeled the points or given you an equation to plug values into, it wouldn’t have tested your knowledge of functions. Your ability to figure out what questions about functions are actually asking is key to solving them correctly on Test Day.
Functions on the PSAT: Multiple Functions
There are several ways in which the PSAT might ask you to juggle multiple functions simultaneously. Fortunately, the rules governing what to do are easy to understand. To start, we’ll look at how to combine functions. This technique simply involves adding, subtracting, multiplying, and/or dividing the functions in play. Check out the following table for a synopsis of how to combine functions with the four basic operations (and make them look less intimidating).
On Test Day, you might see piecewise functions. A piecewise function is a function that is defined, literally, by multiple pieces. What breaks a function into pieces are different rules that govern different parts of the function’s domain. Here’s an example:
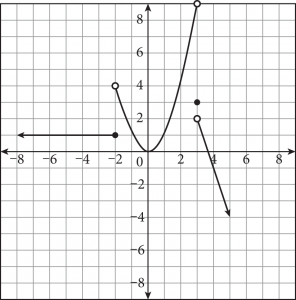
In the function shown, the behavior of the graph depends on the domain. Linear, quadratic, and even a single point interval make up this function. Each “rule” is written inside the open bracket in “pieces.” To the right is the domain interval for which each “rule” applies. On the graph, an open dot indicates that a point is not included in the interval; a closed dot indicates one that is. Note that the different inequality signs used in the domain constraints dictate whether a dot is open or closed on the graph. For a single-point interval, an equal sign is used.
To evaluate a piecewise function, first determine to which piece of the domain the input value belongs, and then substitute the value into the corresponding rule. For example, in the function above, f(2) = (2)2 = 4, because the input value 2 is between –2 and 3 (the second piece of the domain).
Similarly, f(5) = –3(5) + 11 = – 4 because the input value 5 is greater than 3 (the last piece of the domain). You can confirm these values by looking at the graph. At x = 2, the point on the graph is (2, 4), and at x = 5, the point on the graph is (5, – 4).
Give this function question a try:

A. –6
B. –2
C. 3
D. 9
Appearances can be deceiving. At first glance, this question looks tough, but the following table will clarify anything confusing. Kaplan’s strategic thinking is on the left, along with suggested math scratchwork on the right.
| Strategic Thinking | Math Scratchwork |
|---|---|
| Step 1: Read the question, identifying and organizing important information as you go Read carefully to see what the question is asking. You need to find the product (fg) of the results when each function is evaluated at x = –5. |
|
| Step 2: Choose the best strategy to answer the question You could multiply the two functions together and then evaluate the result, but it’s quicker to evaluate each function separately and then multiply. |
f(–5)=2(–5)+1=–10 + 1=–9
g(–5)=(–5)+23=–33=-1 |
| Step 3: Check that you answered the right question The question is asking for the product (fg), which is 9, (D). |
(f g )(–5) = –9 × (–1) = 9 |