PSAT Math: Linear Graphs
On the PSAT Math Test, working with equations algebraically is only half the battle. The PSAT Math Test will also expect you to work with graphs of linear equations, which means using lines in slope-intercept form and point-slope form.
One of the most important quantities you’ll be working with when graphing a linear equation is the slope. Slope is given by the following equation: m = y 2 − y 1 x 2 − x 1 , where (x1, y1) and (x2, y2) are coordinates of points on the line. To remember this, think: slope = rise run .
One of the most common forms of a linear equation is slope-intercept form, which is used to describe the graph of a straight line. The formula is quickly recognizable: y = mx + b. The variables y and x represent the coordinates of a point on the graph through which the line passes, while m tells us what the slope of the line is and b represents the point at which the line intersects the y-axis.
Remember: A line with a positive slope runs up and to the right (“uphill”), and a line with a negative slope runs down and to the right (“downhill”).
In the following figure, lines n and l have positive and negative slopes, respectively.
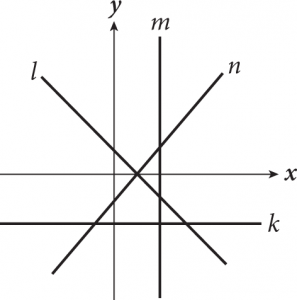
Occasionally, you will encounter a line with a slope of 0—meaning it does not rise or fall from left to right. These lines are easy to spot because they are horizontal and are parallel to the x-axis (line k in the figure shown). Lines that are parallel to the y-axis, such as line m in the figure, have slopes that are “undefined.” The lines themselves exist, but their slopes cannot be calculated numerically.
The slope of a graph can also tell you valuable information about the rate of change of numbers and variables associated with the line. A positive slope signifies an increase in a variable, while a negative slope indicates a decrease. Large numerical values for slope indicate rapid changes, while small numerical values point to more gradual changes. Imagine that the balance in your checking account is B, and that it changes with the number of days that go by, D. Think about how each of the following models would impact your life.
The first equation probably looks pretty good. The second equation isn’t as great. An extra quarter a day isn’t going to do much for you. The third equation would quickly drive you into bankruptcy, while the fourth equation might be cause for concern after a while.
The y-intercept, on the other hand, is often less significant, typically representing the initial condition in a model—that is, where the model begins. In the checking account example, the beginning balance was $75 in all four models. Notice, the y-intercept didn’t change at all.
PSAT Linear Graphs: Practice Question
Look at the following question to see how the PSAT might test your ability to match a linear equation with its graph.
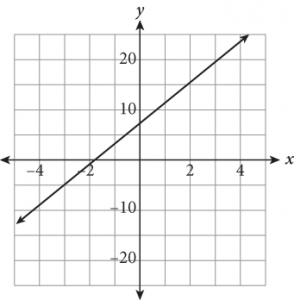
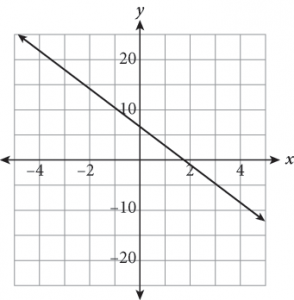
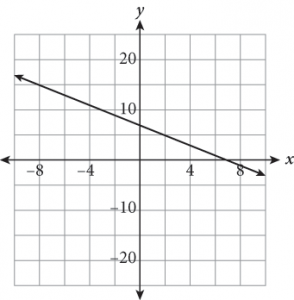
Which of the following shows the graph of the line y = 4x + 7 ?
A.
B.
C.
D.
PSAT Linear Graphs: The Kaplan Method
Approach this question by using the Kaplan Method for Math. Because there isn’t any scratchwork required for a problem like this, only the column containing Kaplan’s strategic thinking is included in the following table. Try to ask yourself similar questions as you work through questions like this on Test Day.
Strategic Thinking
Step 1: Read the question, identifying and organizing important information as you go.
- This question is asking you to match the linear equation to the appropriate graph.
Step 2: Choose the best strategy to answer the question
- What is the fastest way to solve this?
- Should you use your graphic calculator, or can you eliminate some answer choices quickly?
Notice that the graphs are vastly different. You’re looking for a graph that slopes up and to the right (positive slope) and has a y-intercept of +7. Only one of the graphs matches those criteria.
Step 3: Check that you answered the right question.
- Only (A) has a graph with a positive slope and a positive y-intercept.


